Récupérer les statistiques
J’ai donc utilisé le package Laravel Piwik pour récupérer les informations dont j’avais besoin, puis créé des graphiques en SVG manuellement, via un composant Laravel dédié.
La récupération des infos est une simple boucle pas optimisée qui utilise l’API Matomo pour obtenir un résumé des visites des 7 derniers jours :
<?php

use Illuminate\View\Component;
use Illuminate\Support\Carbon;
use RobBrazier\Piwik\Facades\Piwik;

class AnalyticsWidget extends Component
{
	public string $date = 'today';
	public string $period = 'day';

	public array $visits_labels = [];
	public array $visits_values = [];
	public array $time_labels = [];
	public array $time_values = [];
	public ?string $loading_error = null;

	public function __construct()
	{
		$day = new Carbon();
		$visits_labels = [];
		$visits_values = [];
		$time_labels = [];
		$time_values = [];

		try {
			for ($i = 0; $i <= 7; $i++) {
				$stats = Piwik::getVisitsSummary()->get(['period' => $this->period, 'date' => $day->toDateString()]);
				$stats->date = $day->copy();

				$visits_labels[$i] = $stats->date->format('d/m');
				$visits_values[$i] = $stats->nb_visits;

				$time_labels[$i] = $stats->date->format('d/m');
				$time_values[$i] = $stats->avg_time_on_site;

				$day = $day->subDay();
			}

			// On inverse l'ordre des données pour retrouver un ordre chronologique
			$this->visits_labels = array_reverse($visits_labels);
			$this->visits_values = array_reverse($visits_values);
			$this->time_labels = array_reverse($time_labels);
			$this->time_values = array_reverse($time_values);
		} catch (ClientException $error) {
			$this->loading_error = 'Erreur client : '.$error->getMessage();
		} catch (ServerException $error) {
			$this->loading_error = 'Le serveur a rencontré une erreur ('.$error->getResponse()->getStatusCode().' '. $error->getResponse()->getReasonPhrase().')';
		} catch (RequestException $error) {
			$this->loading_error = 'La requête HTTP a échoué';
		}
	}
}
Je peux alors injecter les données à mon composant qui va créer le graphique :
@if(!empty($loading_error))
<div class="widget-content-padding">
	<div class="alert color-error">
		<p><strong>Erreur de chargement</strong></p>
		<p>{{ $loading_error }}</p>
	</div>
</div>
@else
<x-admin.chart :title="__('Visites sur le site')" :labels="$visits_labels" :data-points="$visits_values" left-label="Visites"></x-admin.chart>
<x-admin.chart :title="__('Temps passé sur le site')" :labels="$time_labels" :data-points="$time_values" left-label="Temps"></x-admin.chart>
@endif
Préparer le graphique
Avant de générer le SVG il y a quelques calculs à faire :
<?php

namespace App\View\Components\Admin;

use Illuminate\View\Component;

class Chart extends Component
{
	public float $minValue = 0;
	public float $maxValue = 1;
	public array $yValues = [];

	public int $width = 1000;
	public int $height = 500;
	public float $gutter = 20;
	public float $pointSize = 13;
	public float $pointStrokeSize = 4;
	public float $lineSize = 3;

	public int $leftLabelsNb = 4;

	public float $leftLabelsWidth = 100;
	public float $leftLabelHeight;
	public float $xLabelsHeight = 40;
	public float $xLabelWidth;

	public float $graphWidth;
	public float $graphHeight;

	/**
	 * Create a new component instance.
	 *
	 * @return void
	 */
	public function __construct(public string $title = '', public array $labels = [], public array $dataPoints = [], public string $bottomLabel ='', public string $leftLabel = '')
	{
		$this->labels = $labels;
		$this->dataPoints = $dataPoints;

		if (count($this->dataPoints)) {
			$this->maxValue = max($this->dataPoints);

			for ($i = $this->maxValue; $i >= $this->minValue; $i -= ($this->maxValue - $this->minValue) / ($this->leftLabelsNb - 1)) {
				$this->yValues[] = round($i, 2);
			}
		}

		$this->graphWidth = $this->width - (3 * $this->gutter) - $this->leftLabelsWidth;
		$this->graphHeight = $this->height - (3 * $this->gutter) - $this->xLabelsHeight;

		$this->leftLabelHeight = $this->graphHeight / ($this->leftLabelsNb - 1);
		$this->xLabelWidth = $this->graphWidth / count($this->labels);
	}

	/**
	 * Get the view / contents that represent the component.
	 *
	 * @return \Illuminate\Contracts\View\View|\Closure|string
	 */
	public function render()
	{
		return view('components.admin.chart');
	}
}
On commence donc par calculer la valeur maximale (on pourrait aussi calculer la valeur la plus basse pour supprimer l’espace en bas, si l’écart de valeurs est plus important que les valeurs elles-mêmes) et donc définir l’échelle sur l’axe des ordonnées.
On calcule aussi la largeur des intitulés sur l’axe des abscisses pour les placer correctement.
J’utilise aussi une "gouttière" ($gutter) tout autour du composant, ainsi qu’entre l’axe des ordonnées et le graphique lui-même.
Certaines valeurs sont fixes pour assurer une cohérence entre les graphiques, mais peuvent être rendues paramétrables facilement en les définissant dans le constructeur.
Construction du SVG
<div class="chart">
    <svg version="1.2" xmlns="http://www.w3.org/2000/svg" xmlns:xlink="http://www.w3.org/1999/xlink" viewBox="0 0 {{ $width }} {{ $height }}" class="line-graph" role="img">
        @if(!empty($title))
        <title>{{ $title }}</title>
        @endif

        <g class="grid x-grid" id="xGrid">
            <line x1="{{ (2 * $gutter) + $leftLabelsWidth }}" x2="{{ (2 * $gutter) + $leftLabelsWidth }}" y1="{{ $gutter }}" y2="{{ $gutter + $graphHeight }}"></line>
        </g>
        <g class="grid y-grid" id="yGrid">
            <line x1="{{ (2 * $gutter) + $leftLabelsWidth }}" x2="{{ $width - $gutter }}" y1="{{ $gutter + $graphHeight }}" y2="{{ $gutter + $graphHeight }}"></line>
        </g>

        <rect x="{{ (2 * $gutter) + $leftLabelsWidth }}" y="{{ $gutter }}" width="{{ $graphWidth }}" height="{{ $graphHeight }}" class="data-background"></rect>

        <g class="labels x-labels">
            @foreach ($labels as $i => $value)
            <text x="{{ ($i * $xLabelWidth) + ($xLabelWidth / 2) + (2 * $gutter) + $leftLabelsWidth }}" y="{{ $height - $gutter - ($xLabelsHeight / 2) }}" font-size="{{ $xLabelsHeight * 0.7 }}" text-anchor="middle">{{ $value }}</text>
            @endforeach

            @if(!empty($bottomLabel))
            <text x="{{ (2 * $gutter) + ($graphWidth / 2) }}" y="{{ $height - $gutter }}" font-size="{{ $xLabelsHeight * 0.7 }}" class="label-title" text-anchor="middle">{{ $bottomLabel }}</text>
            @endif
        </g>

        <g class="labels y-labels">
            @foreach($yValues as $i => $value)
            <text x="{{ $gutter + $leftLabelsWidth }}" y="{{ $gutter + ($i * $leftLabelHeight) }}" font-size="{{ $xLabelsHeight * 0.7 }}" text-anchor="end">{{ $value }}</text>
			<line x1="{{ (2 * $gutter) + $leftLabelsWidth }}" y1="{{ $gutter + ($i * $leftLabelHeight) }}" x2="{{ (2 * $gutter) + $leftLabelsWidth + $graphWidth }}" y2="{{ $gutter + ($i * $leftLabelHeight) }}" />
            @endforeach

            @if(!empty($leftLabel))
            <text x="{{ $gutter }}" y="{{ $gutter + ($graphHeight / 2) }}" font-size="{{ $xLabelsHeight * 0.7 }}" class="label-title" text-anchor="start">{{ $leftLabel }}</text>
            @endif
        </g>

        <g class="data">
            <polyline fill="none" stroke-width="{{ $lineSize }}" points="
                @foreach ($dataPoints as $i => $value)
                {{ (2 * $gutter) + $leftLabelsWidth + ($i * $xLabelWidth) + ($xLabelWidth / 2) }},{{ $gutter + $graphHeight - ($graphHeight * (($value - $minValue) / ($maxValue - $minValue))) }}
                @endforeach" />
            @foreach ($dataPoints as $i => $value)
            <circle cx="{{ (2 * $gutter) + $leftLabelsWidth + ($i * $xLabelWidth) + ($xLabelWidth / 2) }}" cy="{{ $gutter + $graphHeight - ($graphHeight * (($value - $minValue) / ($maxValue - $minValue))) }}" data-value="{{ $value }}" r="{{ $pointSize }}" stroke-width="{{ $pointStrokeSize }}"></circle>
            @endforeach
        </g>
    </svg>
</div>
On commence donc par placer un rectangle pour le fond du graphique (histoire de décorer) puis on construit les échelles : l’axe horizontal d’abord puis l’axe vertical (même si l’ordre n’a pas vraiment d’importance).
Ensuite on boucle sur les données pour afficher une ligne, puis on recommence pour les points qui s’y superposent. On pourra leur donner un effet de contour pour cacher un bout de la ligne avec du CSS (et l’attribut stroke-width qui est déjà présent ici).
Un peu de CSS pour rendre ça joli
.chart {
    display: block;
    position: relative;
    width: 100%;
    margin: size(2) auto;

    svg {
        display: block;
        width: 100%;
        overflow: visible;
    }

    .grid {
        stroke: color('gray', 500); // La fonction `color` est déclarée en SCSS pour utiliser un dégradé facilement
        stroke-dasharray: 0;
        stroke-width: 1px;
    }

    .labels {
        text {
            fill: color('gray', 600);
            stroke-width: 0;
            transform: translateY(.5em);
        }
        line {
            stroke: color('gray', 200);
            stroke-width: 1px;
        }
    }

    .label-title {
        stroke: color('gray', 500);
        font-weight: 500;
    }

    .data-background {
        fill: color('gray', 50);
    }
    .data {
        circle {
            fill: color('blue', 500);
            stroke: color('gray', 50);

            &:hover {
                fill: color('blue', 700);
                filter: drop-shadow(0 0 .5rem color('gray', 300));
            }
        }
        polyline {
            stroke: color('blue', 200);
        }
    }
}
Rien de bien compliqué ici, il sagit surtout de rendre le SVG responsive et d’appliquer quelques couleurs. Détail important pour donner le bon effet aux points qui cachent la ligne : on définit stroke (pour le sélecteur .data circle) de la même couleur que la propriété fill du rectangle .data-background.
Et voilà le résultat, avec le widget complet :
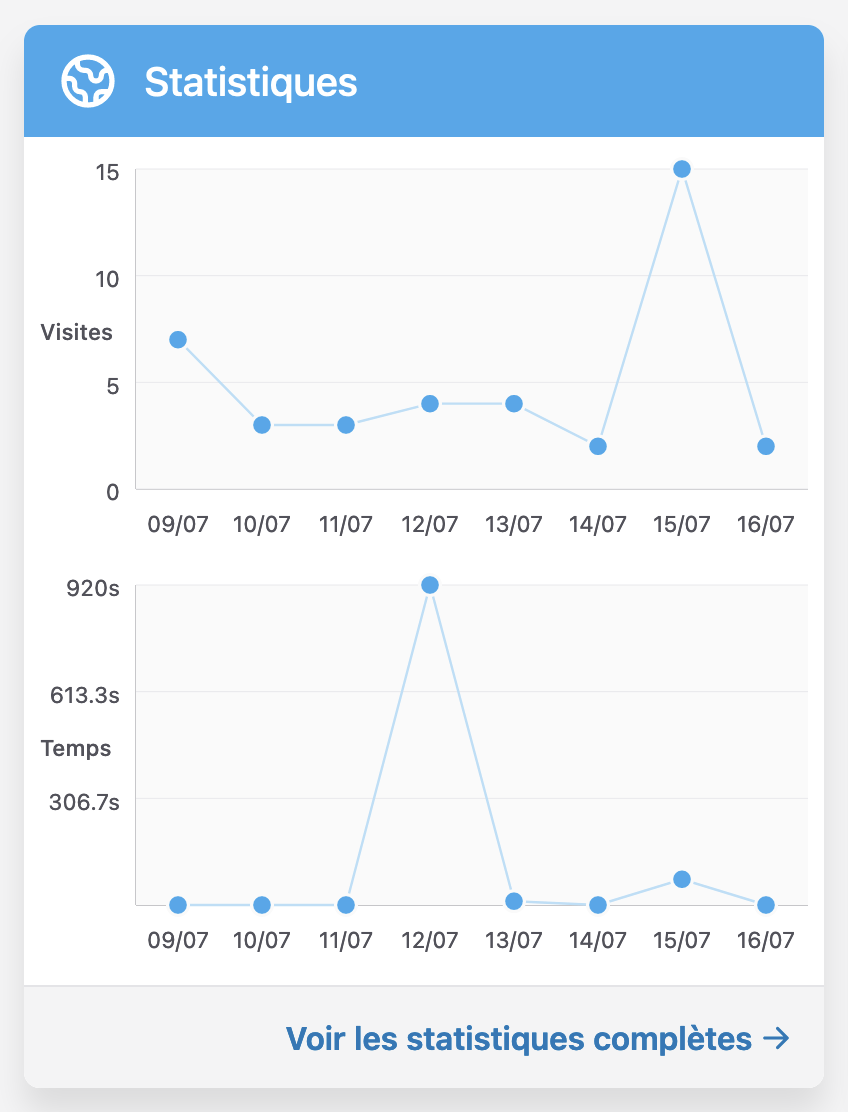 Belle montagne, n’est-ce pas ?